
Analytics dashboard overview
Understand the Analytics V2 dashboard — what each metric means and how revenue is broken down.
The Analytics dashboard shows how much revenue Oxify is generating for your store, broken down by where it came from — the cart drawer, product page offers, post-purchase offers, the thank-you page and checkout offers — along with engagement and conversion figures for each.
This article walks through each section of the dashboard.
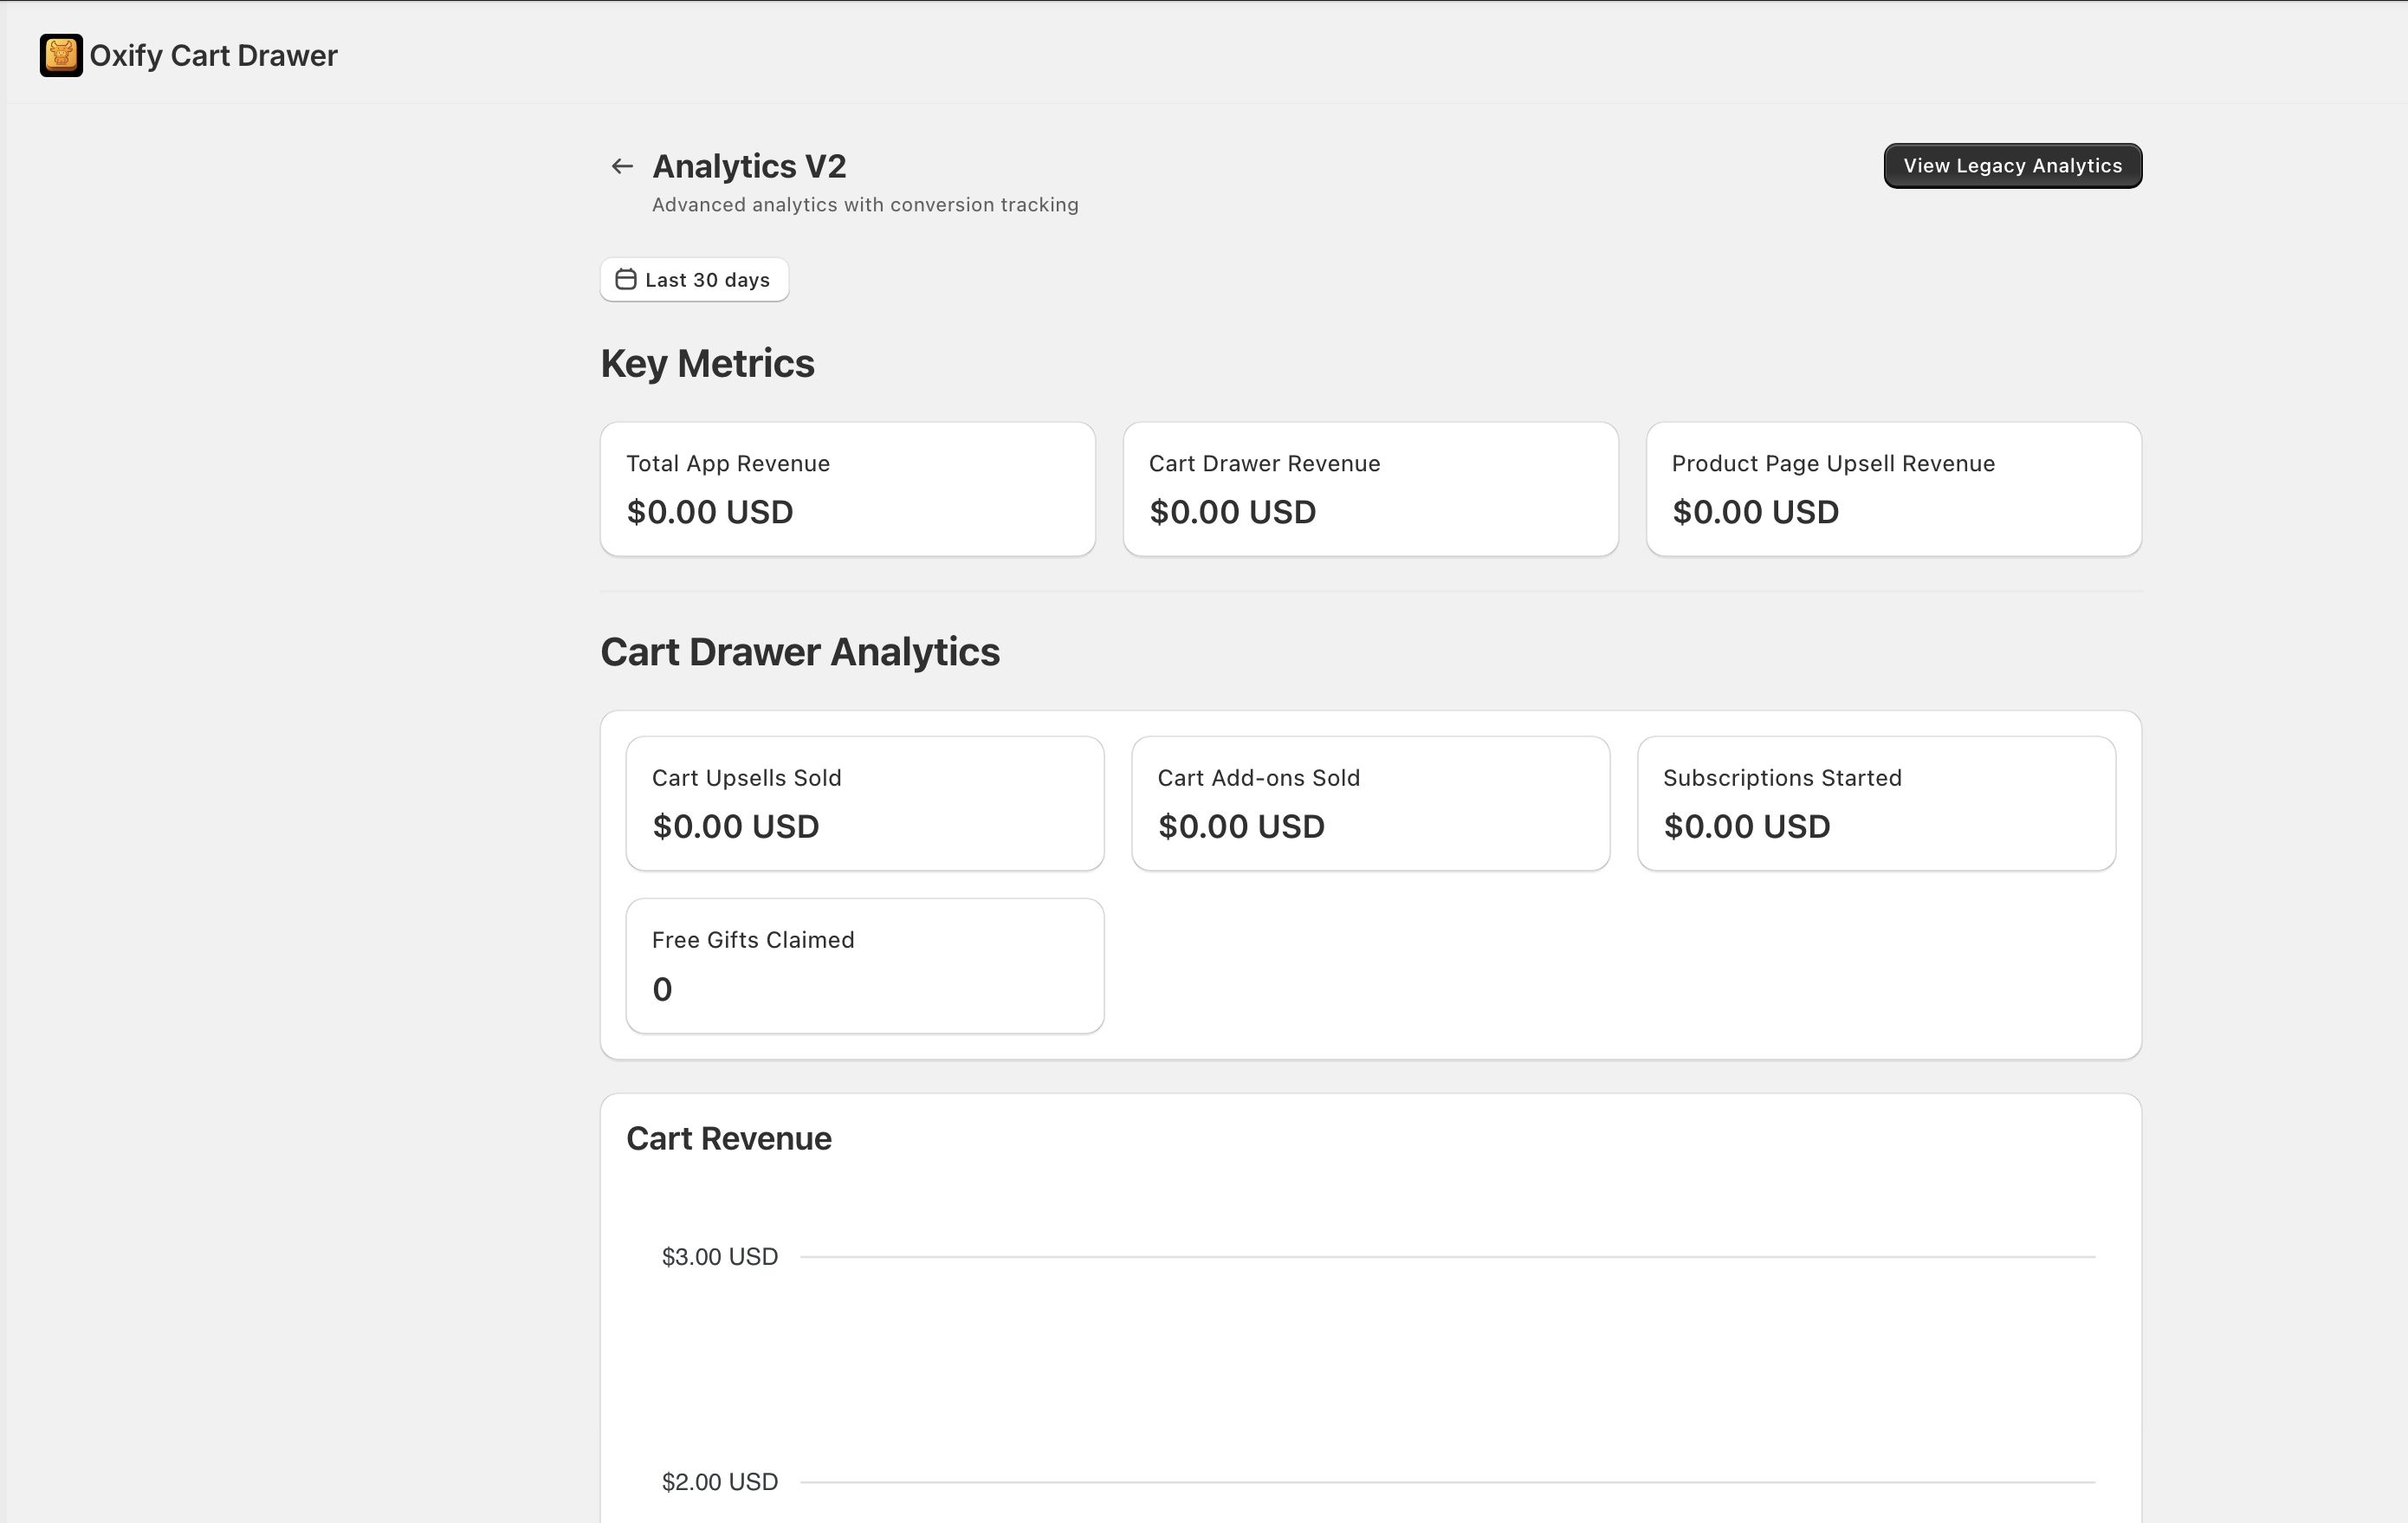
Finding the Analytics dashboard
From the Oxify app menu, click Analytics. (On Home, View full analytics in the App performance section opens the same page.) You'll land on Analytics V2 — our analytics view with conversion tracking.
Controls at the top of the page:
- View Legacy Analytics (top right) — opens the older v1 report if you need to reference older figures.
- Date range — starts on Last 30 days. Choose Today, Yesterday, Last 7 days, Last 30 days, Last 90 days, Last 6 Months, Last 1 Year or Custom. It applies to Key Metrics and to the tab you're viewing.
- Compare to previous period — adds the percentage change against the period just before yours to the metric cards on the tab you're viewing.
- On the Post-Purchase, Thank You Page and Checkout tabs, a picker filters to one funnel (or offer). The Post-Purchase tab also has a Device filter: All, Desktop or Mobile.
Key Metrics
The top of the page shows revenue for the selected date range, one card per source:
- Total App Revenue — the sum of the five cards below. This is the headline number.
- Cart revenue (gross) — revenue from items shoppers added through cart drawer features: upsells, add-ons and subscriptions.
- Product page revenue (gross) — revenue from items added through product page offers: Frequently bought together, Cross-sell and Product add-on.
- Post-Purchase Revenue — revenue from post-purchase offers shoppers accepted.
- Thank you page revenue — revenue from thank-you page offers.
- Checkout offers revenue — revenue from Checkout Offers.
Under the cards, Storefront upsell revenue (gross) shows Cart revenue (gross) plus Product page revenue (gross) as a Combined total.
"Gross" means before discounts — see Reading conversion, revenue, and AOV uplift.
Cart Analytics tab
Revenue, engagement and conversion for the cart drawer. Each card has a trend chart for the selected range.
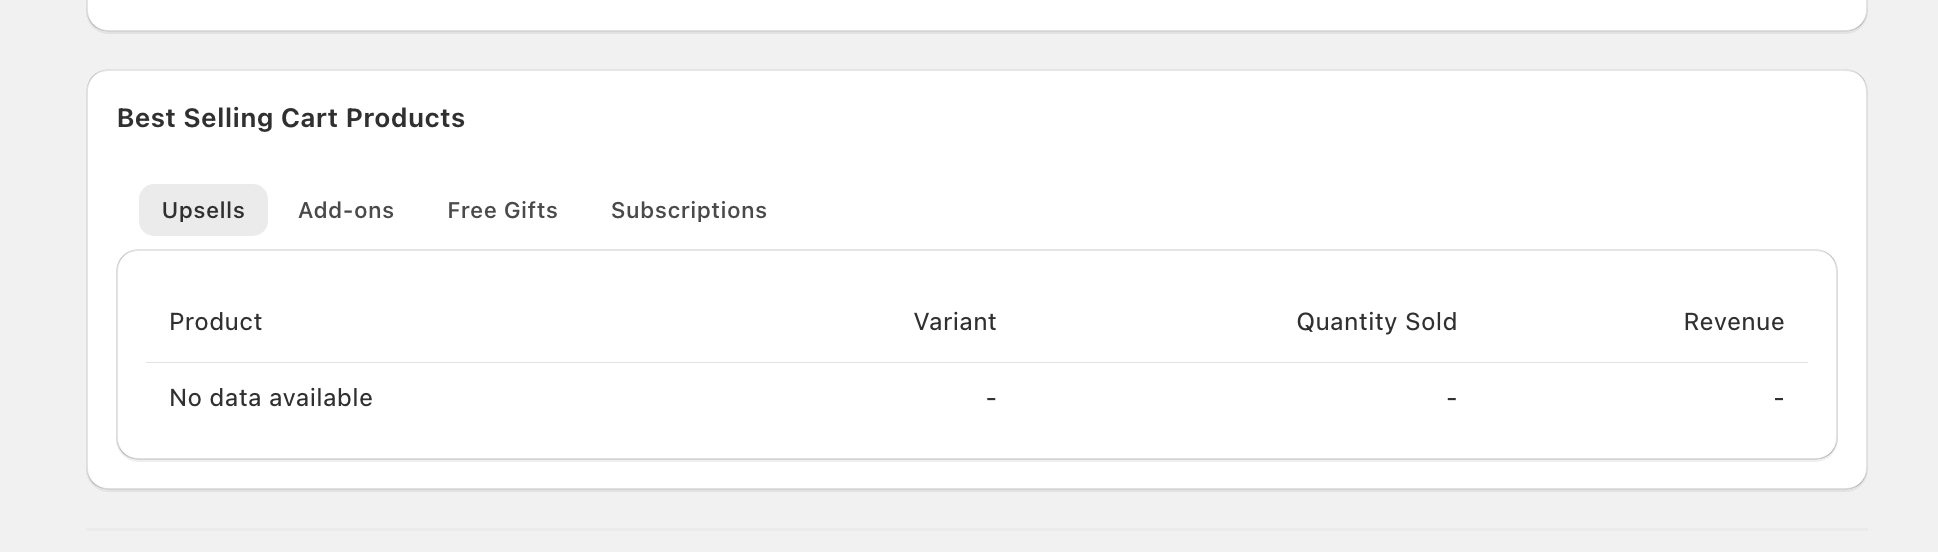
- Revenue — Oxify revenue (gross) (items added through Oxify, before discounts), Influenced order value (the full subtotal of orders that include an Oxify item, without shipping and tax), After discounts, and Est. annual run rate (your gross revenue for the range scaled to a year, marked Estimated).
- Revenue breakdown (gross) — Upsell revenue (gross), Add-on revenue (gross), Subscription revenue (gross) (any order item bought with a subscription plan) and Cross-sell revenue (gross). Product page offers are counted on the Product Page tab instead.
- Value delivered — Discount value unlocked (customer savings on Oxify items), Free gift value delivered (retail value of the gifts given), Free gifts distributed (the number of free gift items in orders) and Discount applications (discount codes shoppers applied in the cart).
- Engagement — Cart opens, Checkout clicks, Unique sessions and Revenue per cart open.
- Conversion — Orders placed, Orders influenced, Attach rate and Conversion rate.
- Top products — switch between Upsells, Add-ons, Free Gifts and Subscriptions to see the best sellers in each, with quantity sold and gross revenue.
Product Page tab
Revenue and engagement for your product page offers.
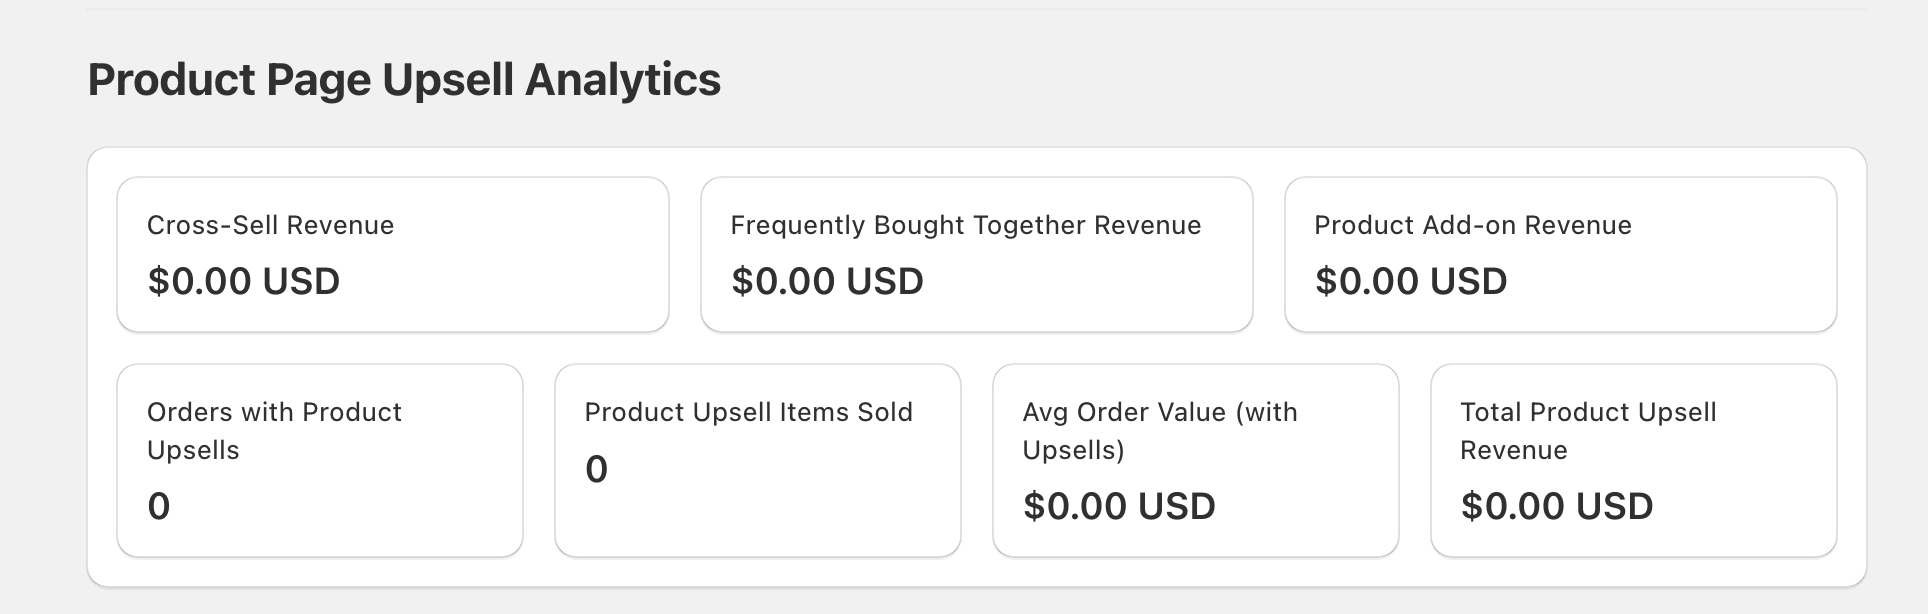
- Revenue — FBT revenue (gross), After discounts, Discount value unlocked and Est. annual run rate.
- By offer type (gross) — Cross-sell revenue (gross), Frequently bought revenue, Product add-on revenue (gross) and Items sold.
- Funnel — Impressions (offers shown), Add-to-cart rate, Orders with FBT, Conversion rate, Unique sessions, Revenue per impression and Average order value. This Average order value is the average gross revenue from product page offers per order that included one — not the value of the whole order.
- Top offers, Top products and Top trigger products — ten rows each, highest gross revenue first.
See FBT analytics for how each figure is counted.
Post-Purchase, Thank You Page and Checkout tabs
These tabs report on post-purchase offers, thank-you page offers and Checkout Offers — revenue, impressions, conversion and your top-performing funnels or offers. See Post-purchase analytics for the post-purchase figures.
How fresh is the data
Cart opens, checkout clicks and product page offer views and adds are sent from your storefront within about ten seconds, and orders are recorded when they're created. Key Metrics and the Cart Analytics tab can lag by up to about five minutes because their totals are cached briefly.
What to actually watch
For most stores, the metrics that matter most are:
- Total App Revenue as a percentage of total store revenue — that's how much Oxify is contributing.
- Attach rate on the Cart Analytics tab — the share of your orders that include at least one Oxify item.
- Add-to-cart rate and Conversion rate on the Product Page tab — whether shoppers take up your product page offers.
- Free gifts distributed trending up over time — confirms your reward thresholds are working.
Legacy Analytics
If you've been using Oxify for a while, you may want to compare against older periods. Click View Legacy Analytics in the top right to switch to the v1 view. It's a simpler report — total, upsell and add-on revenue for a date range you choose, a revenue chart and your top performing products — and it's there for historical reference.