
Analytics
Read visitors, additional revenue, orders, free gifts, AOV and conversion rate for your bundles, compare periods, and drill into one bundle.
The Analytics page shows how your bundles perform across the whole store: how many people saw them, how many orders included a bundle, and how much extra revenue they brought in. It covers your Quantity Break bundles and your Bundle Builders together, and compares every number with the period before.
Open it from Analytics in the app menu. On Home, the chart icon in a bundle's row opens Analytics already filtered to that bundle.
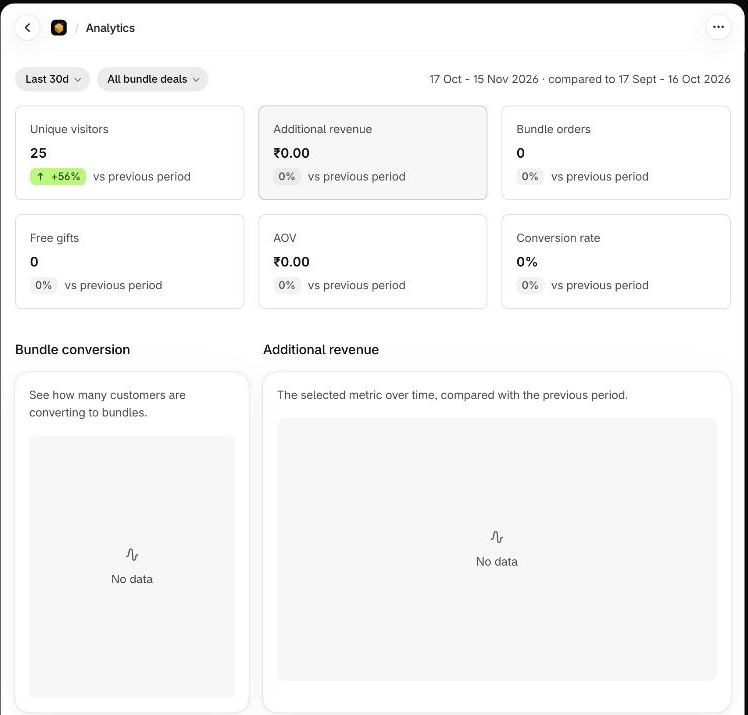
Choose what you're looking at
The filter bar at the top has two menus, and the exact dates are shown at its right.
Date range
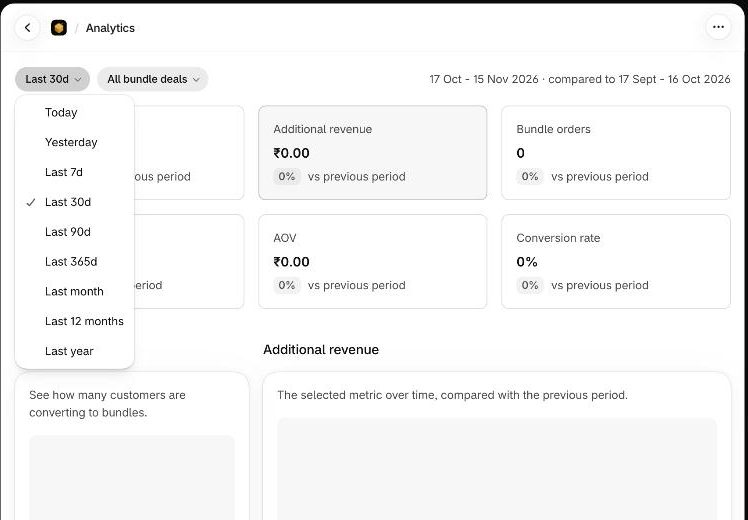
Open the first menu (it shows Last 30d until you change it) and pick one of:
Today, Yesterday, Last 7d, Last 30d, Last 90d, Last 365d, Last month, Last 12 months or Last year.
The tick marks the range you are on. The text at the right of the filter bar spells out the dates and the period they are compared with, for example 17 Oct - 15 Nov 2026 · compared to 17 Sept - 16 Oct 2026. The comparison period is the stretch of time of the same length immediately before the one you picked.
Bundle
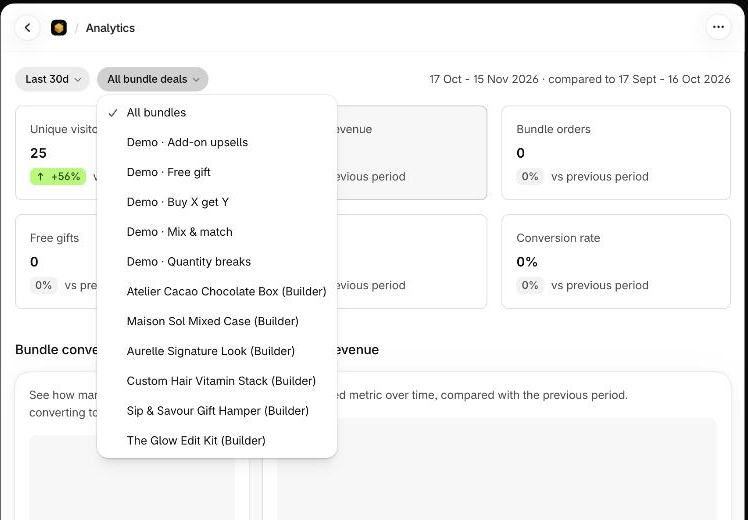
The second menu starts on All bundle deals. Open it to choose All bundles or one bundle. Quantity Break bundles are listed first, then Bundle Builders, marked (Builder) after the name. Choosing one bundle filters every number and chart on the page to it.
When you change either menu, a Clear filters button appears. Click it to go back to Last 30d and all bundles.
The numbers
Each tile shows a value and a badge comparing it with the previous period (vs previous period), such as a green +56% or a grey 0%.
| Tile | What it means |
|---|---|
| Unique visitors | Total unique visitors in the selected period. |
| Additional revenue | Total additional revenue in the selected period. |
| Bundle orders | Total number of orders that included a bundle. |
| Free gifts | Total number of free gifts given to customers in the selected period. Hidden when a Bundle Builder is selected, because builders have no free-gift offers. |
| AOV | Average order value: additional revenue divided by bundle orders. |
| Conversion rate | Bundle orders divided by the number of visitors. |
A dash instead of a conversion rate
If there are more orders than recorded visitors, the rate can't be calculated reliably, so the tile shows a dash and its tooltip explains why: Not enough visitor data to calculate this reliably — there are more orders than recorded visitors. Try a wider date range.
The charts
Two charts sit under the tiles. On a narrow screen they stack.
- Bundle conversion — a donut chart that splits your bundle orders by offer, and by A/B version while a test runs. It answers "which offer are customers choosing?".
- The selected metric over time — a line chart for one tile, comparing the current period with the previous one. Its title is the tile's name. It starts on Additional revenue. Click another tile to plot that metric instead — the selected tile has a grey background. Switching tiles is instant and doesn't reload the data.
Where there is nothing to draw, a chart says No data.
Top Performing Bundles
When you are looking at All bundles and some bundles had orders, a Top Performing Bundles table appears under the charts:
| Column | What it shows |
|---|---|
| Bundle name | The bundle. Click it to open it in its editor. |
| Orders | Bundle orders in the selected period. |
| Additional revenue | Additional revenue in the selected period. |
| Actions | View analytics filters the whole page to that bundle. |
The table is hidden once you filter to one bundle.
Empty and error states
| What you see | What it means |
|---|---|
| No published bundles yet | You have no bundles and no activity. The page points you to Create a bundle. Analytics appear once a bundle is published and starts getting views and orders. |
| A banner: No bundle activity in this period | Visitors, orders and additional revenue are all zero. Try a wider date range, or check that your bundle is published and visible on your storefront. |
| Couldn't load analytics | Something went wrong. Click Reload. |
| Couldn't load the charts | The numbers loaded but the charts didn't. Reload the page. |
Related
- Bundle Builder analytics for builders.
- A/B testing to compare versions of one bundle and pick a winner.